
ENGINEERING INSIGHT | METERING & EMBEDDED SYSTEMS
How acquisition, signal processing, calibration and firmware design turn measurements into trustworthy readings
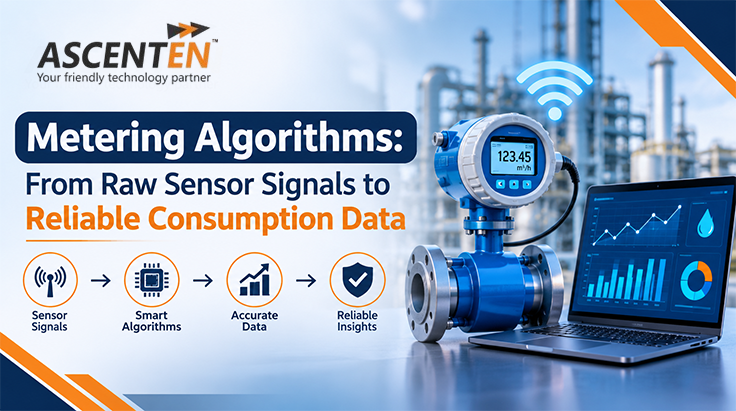
A meter is not a measurement of consumption. It records the use of a physical value (e.g. voltage, current, flow, pressure) and applies a series of hardware and software operations to approximate the amount consumed. If there is a small error at the start of this chain, it can be magnified through the final reading; if the algorithm is badly designed, errors can also occur if the sensor and analogue circuitry are suitable.
Metering algorithms, therefore, are not just about making calculations. They control sampled data, adjust for known effects, gather data over time, detect anomalies and maintain data quality for recorded consumption. The design should take into account the accuracy, speed, processing expense, power usage, and application needs.
A common approach for conducting a digital metering path includes the following process: physical quantity → sensor/transducer → analogue front end (if required) → anti-aliasing & sampling → digital signal processing (DSP) → calibration and correction → instantaneous measurement → time-integration → result storage and communication. Such a path may be defined in terms of the meter types. Water and gas meters can use pulses or ultrasonic transit time or pressure differential, among other ways, to measure flow, whereas electric meters can measure the voltage and current waveforms.
The main design concept is to approach the system as a whole. The resolution of the ADC is not the solution, and it will not be able to resolve the problem created by the inappropriate choice of the sensor and sophisticated filtering algorithms will not be able to extract information which was not collected in the first place. Requirements should be specified before the algorithm design regarding the range, dynamics, environment, accuracy, and faulty behaviour.
The sensor is used to transform a physical quantity into a measurable signal. The range, sensitivity, linearity, bandwidth, repeatability and temperature behaviour are all factors that will affect the result. The analogue front end then scales and conditions that signal to ensure that it falls into the range of the converter without clipping and wasting too much of it.
An anti-aliasing filter might be necessary prior to sampling for analogue inputs. When the signal frequency exceeds half of the sampling frequency, it can be measured as a low frequency component of the sampled signal. This sampling rate should then be based on the signal bandwidth and measurement method and not just on the processor's ability to handle it alone.
Sampling timing is also important. For the accuracy of the power that is desired, the voltage and current samples must be time aligned closely in AC metering. Missed pulses, duplicating pulses, or having poorly timed pulses will directly affect the cumulative volume in pulse measurements. Firmware should identify buffer overflows, missing samples and invalid sensor states, and not ignore them as though they were simply normal data.
Real measurements include offset, gain error, noise, interference and occasionally transient disturbances. Signal conditioning can involve amplification, attenuation, bias removal and analogue filtering. They can then be low-pass and moving-average or median or application-specific filters through digital processing.
There is no one best filter. Moving average is easy to use and can help to reduce the random variation but introduces some time lag and may smooth out real changes. The low-pass filter can help to attenuate high-frequency noise, but the cutoff and phase response characteristics are important. Median filters can suppress spikes when they are isolated, but they may not be good for capturing the shape of the waveforms. Select a filter for the signal, disturbance model and desired response time; then check the actual measurement's response to the filter.
The word filtering must not be used to mean "noise elimination" or "automatic improvement of accuracy". It can make things more stable, but it can also cause bias, lag or distortion in the waveform. The goal is actually to eliminate unwanted parts, while keeping information necessary to the measurement algorithm.
The Root Mean Square (RMS) value is the effective value of the voltage or current over a specified time interval for sampled AC voltage or current. The discrete RMS calculation is:
The formula squaring the samples, computing the average of the squares, and taking the square root. It is dependent on both the scaling and sampling of the data, the size of the window, and offset handling. The window size should be adequate for the type of signal being processed and the required update rate; if too small, it causes instability, and if too large, it causes slow response.
RMS voltage and current are not active power. For synchronously sampled instantaneous voltage vₙ and current iₙ, a basic estimate of active power over a window is:
This calculation maintains the relationship between voltage and current samples and can include non-sinusoidal waveforms if the bandwidth of acquisition and sampling is sufficient. The product of RMS voltage and RMS current is the apparent power (not always the active power).
Consumption is typically an integral over time of a measured rate. For electrical energy, a simplest approximation is:
Here Pₙ is the estimated power over interval n and Δtₙ is that interval’s duration. When energy is calculated in kilowatts and time in hours, the result is kilowatt hours. If a flow-rate is measured in units of time, and a volume is measured in units of time, then for fluid metering, integrating the flow-rate over time will yield the cumulative volume.
A good implementation takes elapsed time into consideration, not assuming that all processing cycles will happen at the same time. It should be clear what to do if samples have been lost, the processor has reset, communication has been lost or if the meter is put in a low power mode. Use appropriate numeric accuracy, prevent overflow and underflow, and maintain cumulative totals that can be recovered in case of power failure. All of these details are as relevant as the integration formula.
Calibration is establishing a relationship between a meter's output and a proper reference. It may require offset and gain coefficients, linearisation, multi-point tables or a model calculated from the results of controlled tests. The calibration data must be traceable to the test setup and versioned and integrity checked.
Compensation is used for known influences such as temperature, if relevant, pressure and other properties of the measured medium. In certain gas applications, it might be necessary to convert the volume to defined reference conditions. The choice of model is related to the metering technology, the gas characteristics, the product specification and the applicable legal-metrology requirements. Without validation of assumptions, applying a generic correction may increase, not decrease, error.
If possible, separate the design of calibration from compensation: calibration is done to set measured behaviour to match a reference; compensation is performed to estimate the effect of a known influence on behaviour. They should be checked at more than one value of the parameter, not just one nominal value.
Certain meters need to be able to tell the difference between forward and reverse flow, or import and export electrical energy. The algorithm must specify the convention of the sign, the value of the threshold, how to handle small noisy values and how to record each direction. In electrical systems, direction is determined by the voltage-Current relationship, and in fluid systems, by the sensor and flow-measurement method.
Event logic is able to track undervoltage, supply interruption, unusual demand, abnormal flow and measurements outside of configured limits. It is important to include persistence or hysteresis in thresholds wherever possible to avoid multiple triggering of false events. The appearance of one odd reading does not necessarily mean that it has been tampered: other factors such as legitimate installation changes, faults and sensor failures can result in similar symptoms.
If using tamper indicators, separate the measured evidence, detection rule, event timestamp and final event classification. Record sufficient context for investigation and safeguard event data and calibration parameters from unintended change. The implementation should be based on the requirements that apply to the product, and its threat model.
Battery powered water and gas meters can be in sleep-mode for a large percentage of the time and will wake up periodically or when a sensor event occurs. Low-power strategies may involve the use of hardware timers and peripherals, batching processing (where possible in the measurement method), decreasing unnecessary wake-ups, and selecting computationally efficient filters.
The lower the sampling frequency or less often processed is not safe. If a change is made they need to have the changed item checked for missed events, degraded measurement performance, delayed response, and incorrect accumulation. Measure energy consumption in addition to metrological performance such as wake up behaviour, long idle periods and recovery after low voltage.
Imagine an electricity meter that takes voltage and current samples, calculate the active power, and stores energy. It can be useful to engineer a test to compare the meter with a suitable reference at several operating points, not just a steady nominal load. Consider low and high current, power factors, varying loads, distorted wave form if applicable and environmental range of the product.
| Test area | What to verify | Typical failure to look for |
|---|---|---|
| Acquisition | Scaling, clipping, sample timing | Saturation or phase mismatch |
| Signal processing | Filter response and window length | Excessive lag or waveform distortion |
| Power calculation | Reference comparison across power factors | RMS values mistaken for active power |
| Energy accumulation | Elapsed-time handling and long-duration totals | Drift, overflow or lost intervals |
| Calibration | Repeatability and performance across range | Overfitting to one test point |
| Fault recovery | Reset, low voltage and missing-sample behaviour | Lost or duplicated consumption |
- Define requirements: Specific range, accuracy, response time, operating environment, power budget and applicable market requirements.
- Describe the characteristics of the sensor: Offset, Sensitivity, Linearity, Noise, Bandwidth and Temperature response.
- Design acquisition: Choosing analogue front end, ADC, sampling rate, sampling strategy; Evaluation of aliasing and synchronisation.
- Apply algorithms: Document, scale, filter, numeric formatting, overflow and integration rules.
- Calibrate and compensate: Use appropriate references and check corrections over the range.
- Test edge cases: start up, reset, missed sample, reversing, low signal, overload and low power transitions.
- Validate and release: Check against reference equipment, keep evidence, check changes and perform regression testing on changes to the firmware.
Metering algorithms are placed between the sensor behaviour, analogue electronics, sampling, DSP, calibration and embedded firmware. The formulas must be accurate, but not sufficient. The entire system should maintain signal information, be correct in units and time, have provisions for extraordinary events, and be checked for fidelity to appropriate references within the expected operating range.
In metering product teams, the best way to go is to properly identify measurable requirements as early as possible, make assumptions about the algorithm explicit, and test both normal and fail scenarios. This will make it more difficult to defend the way from raw sensor data to reliable consumption records.
How Ascenten Technologies can support metering development
Ascenten Technologies provides engineering support for embedded software, electronics design, prototyping, and verification of embedded systems. Engineering support for metering products includes development of sensor interfaces, embedded firmware, signal processing, calibration, power reduction, and validation among others. These are to be in line with the architecture of the product, target market, and metrology requirements.
Discuss Your Metering ProjectEditorial note before publication: For any accuracy statements for any products, check with the relevant engineering team before publication, as well as applicable engineering standards and legal-metrology. Include an actual, approved case study or actual measured result, if available, but don't use illustrative test conditions as actual customer results.
Contact Us
We would really like to hear from you and answer any questions. Please email us at info1@ascenten.net
or call us on
India Landline: +91-79-2646 4646
India Mobile: +91-89800 00973