Home > Battery Life in Years
Admin | Posted on 31/05/12
With portability and ever-shrinking form factors being tremendously sought after by consumers worldwide in electronic products, a major challenge lies ahead for designers in terms of developing ultra-low power designs to aptly complement market expectations. This makes the battery life of a product an extremely crucial factor in its success and widespread adoption. When the life of the battery is expected to be for a few days or months, it is easy to measure the battery life practically. But if the product is required to work for a few years on the battery, then the only way is to measure the average current and, based on that, estimate the battery life.
The current waveform may be very complex, typically comprising a superimposition of various waveforms like AC signals, ramps, rectangles, DC, etc. To find the average current from this waveform, we would need to separate the different components of the waveform and apply the proper equations (integration). This derives the average current for each component, which should then be summed up. This method is not only very complicated but also prone to errors, making it unsuitable. For accurate analysis, this method also requires a very good quality digital storage oscilloscope.
There are various pieces of equipment available to measure this average current, but the cost of the equipment may exceed the project cost. The simplest method is by using an RC circuit as an integrator for the raw signal.
The RC integrator circuit performs the integration of the input waveform and provides a result at the output. We only measure the voltage at the output and divide this voltage by the value of the current sense resistor. The result is the averaged current.
Here, the critical part is the value of R and C. The lowest repetitive period for the product is considered. The RC time constant should be very high (10 to 100 times) compared to the maximum time period.
For example, if the product has events occurring at 1 Hz, 32 Hz, 0.1 Hz, and 1 kHz, we would consider the lowest frequency 0.1 Hz and hence the time constant would be around 10 seconds. Reference circuit design is shown in Figure 1.
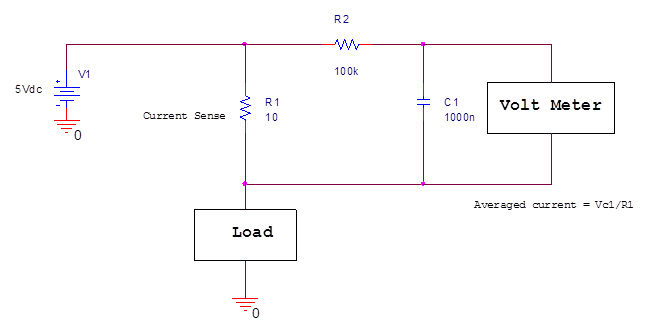
Figure 1: Reference Circuit
The capacitor type selection is very important. Theoretically, accuracy is 100% only if the capacitor is lossless. So, the accuracy of measurement depends highly on the capacitor characteristics. Polarized capacitors like tantalum and electrolytic capacitors have quite high leakage currents, which drastically reduce measurement accuracy. Hence, the best choice is a ceramic capacitor with the least amount of leakage.
Also, the components need to be SMD, since a leaded component would introduce stray resistance and capacitance, which would hinder accuracy. Additionally, SMD components can be placed very close together to improve noise immunity.
As shown in the simulation below, a square wave source (5V level) is used, and the connected total load is 5K ohms. If the duty cycle of the square wave is 50%, then the averaged current should be 0.5 mA, making the averaged voltage across the capacitor 10 × 0.5 mA = 5 mV. Simulation results, as shown in Figure 3, confirm the same 5 mV reading.
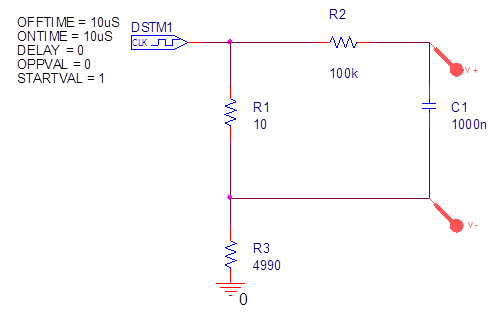
Figure 2: Simulation Circuit
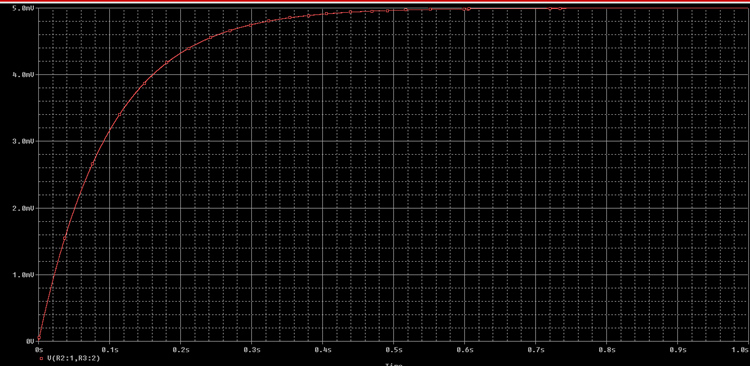
Figure 3: Simulation result of above circuit
On changing the duty cycle to 10% the result should be reduced 5 times compared to the 50% duty cycle. Figure 4 is the same circuit with 10% duty cycle of rectangle waveform. Now the reading should be 1mV. The simulated result shown in figure 5 gives the same results and proves that averaging is working accurately.
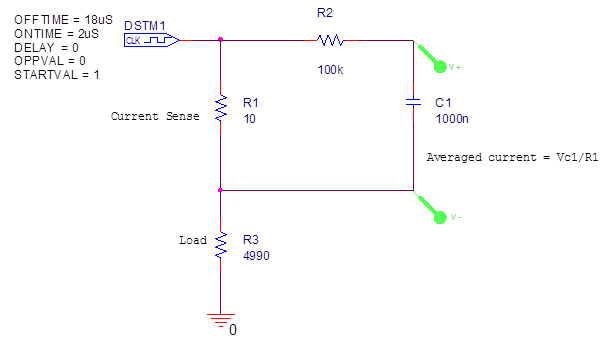
Figure 4: Simulation circuit
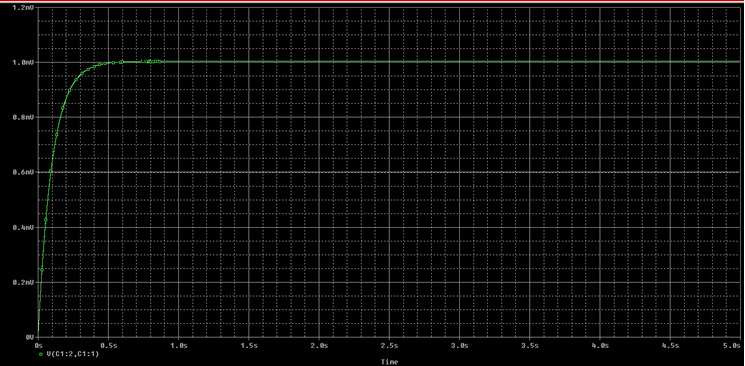
Figure 5: Simulation result of above circuit
We would really like to hear from you and answer any questions. Please email us at info1@ascenten.net
or call us on
India Mobile: +91-89800 00973
India Landline: +91-79-2646 4646
Home | Careers | Ethics | Privacy Policy | Terms Of Use | Code Of Conduct
